Nodeflux Vehicle Analytics is a Vision Artificial Intelligence Analytics Software which provides multiple analytics to ensure vehicle management is monitored in an effective and efficient way. Using deep learning algorithms to enhance the accuracy of vehicle's inferencing, Nodeflux Vehicle Analytics automatically detects vehicle's attributes and behavior as well as provide the result analytics inferences including vehicle counting (with attributes available), vehicle dwelling, and vehicle density.
Vehicle Analytics - Counting, Dwelling, DensityVehicle Counting
Nodeflux Vehicle Counting is a Vision Artificial Intelligence Analytics Software that allows you to know the number of vehicles and their classification into up to 23 types in a particular area with multiple regions of interest using a benchmarking line. This can be done to capture vehicle's traffic, like at the road trespassing, highway, traffic dense road, parking area, etc. Using Nodeflux Vehicle Counting, organizations can seamlessly gather the number of vehicle data and analyze peak hours in each respective area.
Vehicle Dwelling
Nodeflux Vehicle Dwelling is a Vision Artificial Intelligence Analytics Software that allows you to know the number of vehicles in a particular area and how long they stay at the same position. This can be used to capture vehicle's traffic, like at the crossroads, gate, and etc. Using Nodeflux Vehicle Dwelling, organizations can seamlessly gather the number of vehicle data, how long they stay at the same position and analyze their behavior in each respective area. The analytics helps users to identify vehicle’s stop duration in a certain area. This data will then enable stakeholders (e.g police department, or local traffic department) to evaluate the efficiency of the current traffic system.
Vehicle Density
Nodeflux Vehicle Density is a Vision AI analytics software which aims to measure the number of Vehicles at scaled density in an area of interest. The analytics work within the common practice is to count each vehicle automatically to get an insightful report. The inference result will provide you the exact number of vehicles in a particular area of interest at scaled density.
Vehicle Analytics with Attributes
Nodeflux Vehicle Analytics with Attributes is same as the Vehicle Analytics only explained above excluding the logic of Vehicle Density. The Vision AI analytics software provides the enrichment data of vehicle attributes within the vehicle detection in Vehicle Counting and People Dwelling.
Vehicle Analytics with Attributes aims to recognize color, type, brand attributes of a vehicle (car, truck, bus). For now, the analytics does not support motorcycles attributes.
Attributes:
Color: black, white, gray, silver, red, blue, yellow, orange, brown, green, maroon, golden, purple, other
Type: SUV, MPV, wagon, hatchback, sedan, pickup, convertible, van, truck, other
Brand: Toyota, Honda, Mercedes-Benz, BMW, Suzuki, Daihatsu, Mitsubishi, Nissan, Hyundai, Mazda, Wuling, Lexus, MINI, Land Rover, Porsche, Ford, Volkswagen, Chevrolet, KIA, Jeep, Chery, Isuzu, MG, Audi, other
Visionaire Vehicle Analytics utilizes a combination of other services:
Docker Snapshot - For Vehicle Analytics with Attributes related. See the documentation here
Visionaire Docker Stream - For video stream processing.
Visionaire Dashboard (Optional) - Built-in dashboard for visualization.
Camera Specification
Camera Settings
Vehicle Analytics
General Analytics
Exposure Time/Shutter Speed
Camera Placement
1. Camera Placement Guidelines for Vehicle Analytics
Height: Position cameras for traffic 3 - 4.5 meters and for parking around 1 - 2 meters.
Distance: For optimal results, place cameras within approximately less than 35 meters. This range is crucial to capture sufficient vehicle details.
Location: Select locations with minimal obstructions and consistent vehicle traffic for effective analytics.
CCTV Installment Guideline 2. Lighting for Optimal Vehicle Analytics:
Uniform Lighting: Aim for evenly distributed lighting to prevent shadows or overly bright spots on vehicles.
Avoid Backlighting: Ensure that light sources are not directly behind vehicles to prevent silhouetted images.
Natural vs. Artificial Light: Use natural light when possible, supplemented with artificial light for consistency. Avoid flickering light sources like fluorescent lights.
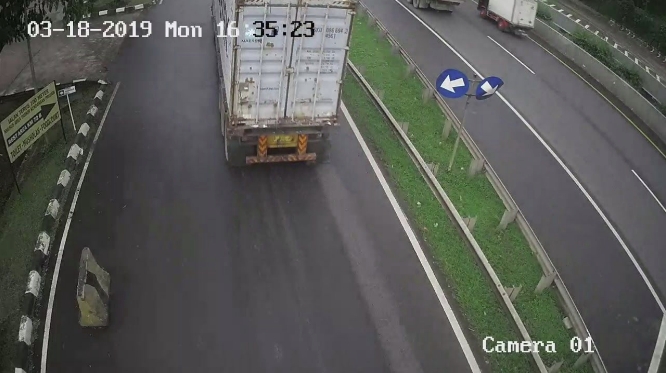
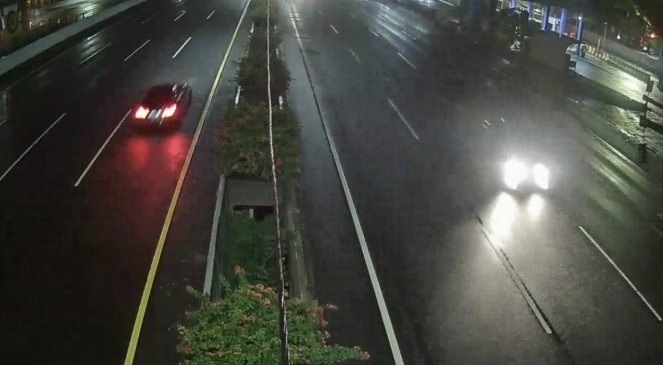
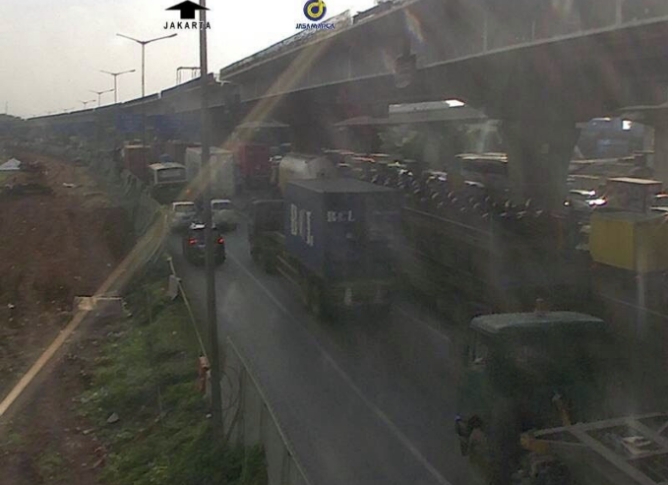
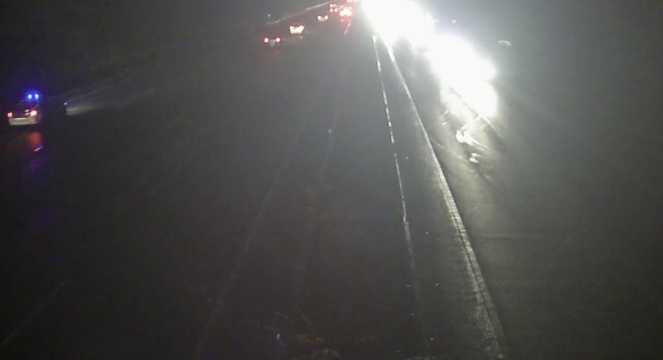
The image below is the restricted condition for Vehicle Analytics.


The angle does not cover the whole vehicle
Too crowded which led to occlusions
3. Angle of Capture for Vehicle Analytics
Direct Angles: The optimal tilt angle for the camera is between 60 and 80 degrees from the Y-axis.
Avoid High or Low Angles: Steep and wide angles can cause distortion of vehicle features, affecting analytics accuracy.
Multi-Camera Setups: For covering different angles, consider deploying multiple cameras at strategic positions.
4. Camera Image Settings for Vehicle Analytics
Resolution: Utilize cameras with high resolution (at least 1080p) to capture detailed vehicle features.
Frame Rate: A higher frame rate, such as 15fps or more, ensures smoother footage for capturing clear images of moving vehicles.
Focus and Zoom: Enable auto-focus to adjust for varying distances. Avoid excessive zoom as it can degrade image quality.
Exposure and Contrast: Set exposure and contrast levels appropriately to ensure vehicles are neither overexposed nor too dark.
Clearly visible to detect and classify vehicles even far view Clearly visible to detect and classify vehicles even far view Placed in the highway with low pedestrian captured Too crowded which led to occlusions The angle does not cover the whole vehicle Deployment Schema